A Red Team Range In The Home Lab
About the Project
C2 Frameworks seem to keep popping up with neat features and add-ons. I wanted to create a lab environment where I could experiment with said utilities, and understand what the forensic footprint looked like for each tool. This led to “shellcompany.lan”, my red team range environment for tool testing and experimentation.
Environment Considerations & Initial Design
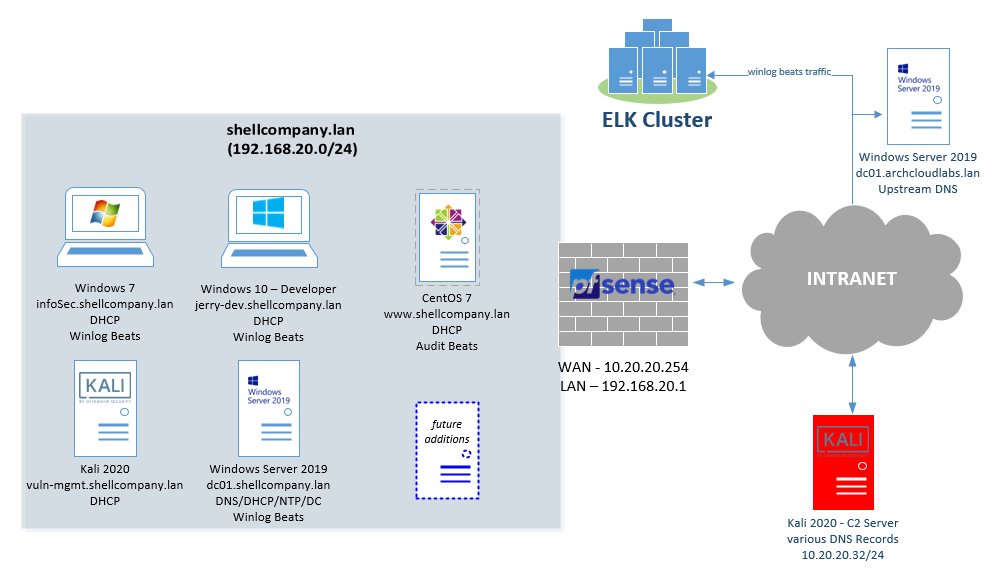
When initially designing the environment, I wanted to emulate a small business network with significant logging of both host and network data. Having a Windows domain with domain-joined clients would give me a baseline of normal traffic occurring prior to any actions from a C2 framework, and allow me a better understanding of Windows environments. Introducing a pfSense firewall also allows tweaks to network traffic. For example, introducing latency or adding IDS/IPS rules via 3rd party packages. After a couple of iterations, the final deployment can be seen below.
ESXi vSwitches
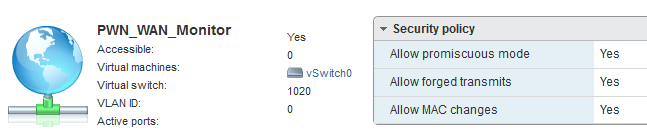
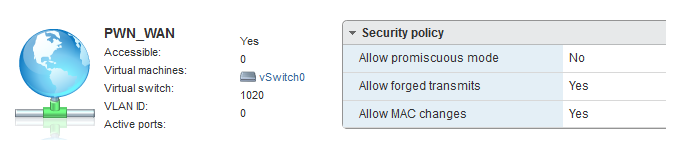
Four new vSwitches were created for this environment. This includes a PWN-LAN, PWN-LAN-Monitor, PWN-WAN and PWN-WAN-Monitor. Each of these vSwitches are on the same VLAN. However, two specific vSwitches have promiscuous mode enabled for troubleshooting connectivity as well as employing IDS/IPS solutions. Having two separate vSwitches also enables easy re-configuration to perform packet captures during tool testing.
Logging Infrastructure - Basics
If you google “open source logging”, you will find a significant amount of resources with a variety of different platforms. I have already deployed an ELK cluster for various other projects and that served as the core of the SIEM for this project. I recommend all to look at the official documentation to get started with their own ELK deployment. Elastic Co also offers log shippers for both Windows and Linux in the form of Winlogbeat and Auditbeat. These utilities differ from Elastic Co’s Filebeats as they focus on sending operating system specific security logs (Windows Event logs & AuditD logs). Installation is simple and easily documented for both utilities. The real depth comes into how you configure the utilities and what data they send.
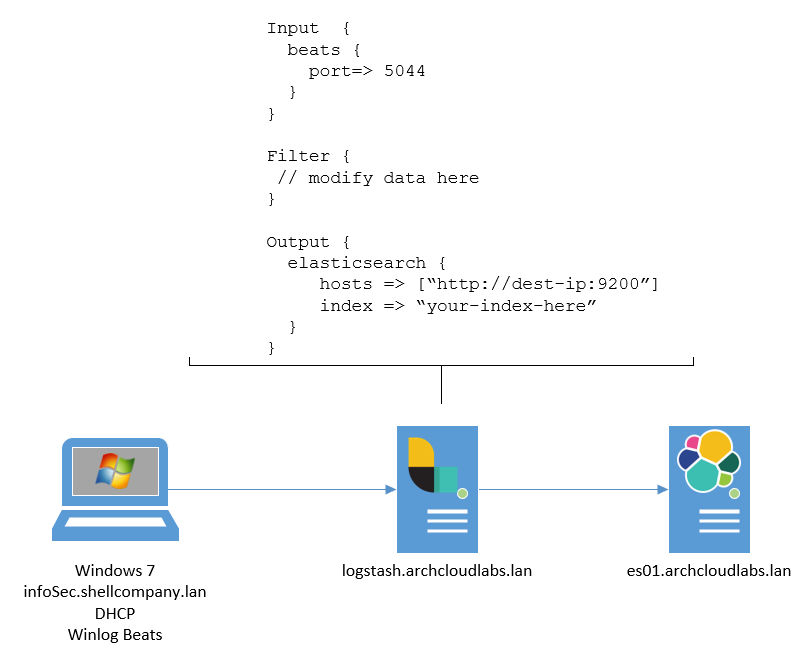
Filebeats can send data directly into Elasticsearch (via ingest nodes) or it can first send data to Logstash or another message broker. Sending data to a message broker is typically done to receive data enrichment prior to being ingested into Elasticsearch. In some cases, it can serve as a central location for a disperse sent of clients to send data to prior to ingestion and prevent “back pressure” issues. The image below shows a dead-simple way to introduce Logstash into a Winlogbeats environment.
The design of logging pipelines is an extensive topic that greatly depends on core infrastructure pre-existing environment. Given the test range, Winlogbeats and Filebeats is sending data into Logstash. Unmodified pfSense syslog is difficult to parse within Kibana. If raw syslog data is ingested from pfSense, a message field is created with the entire log making it difficult to parse and search upon. An image below shows what unmodified syslog data from pfSense looks like.
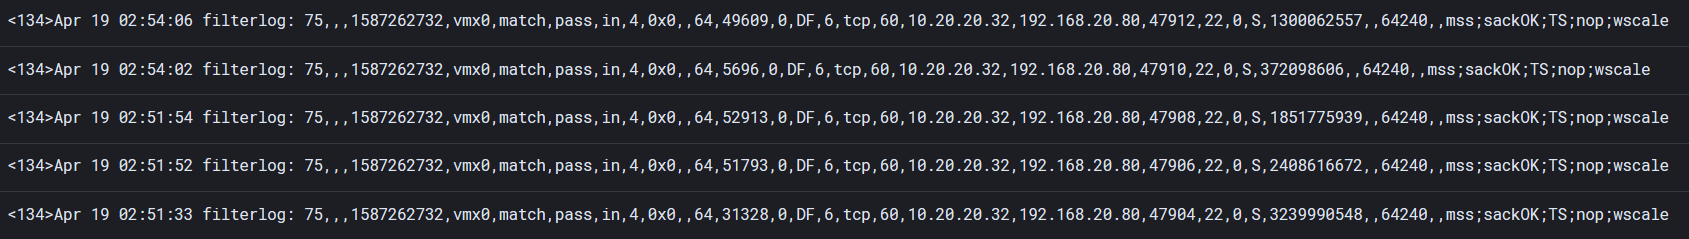
By applying this logstash configuration, its significantly easier to parse said data because individual elements are broken out into fields.
Logging Infrastructure - Winlogbeat & Sysmon
Winlogbeat allows you to specify what event logs within Windows to forward. This by itself can be useful, but to really dig into actions on a host an additional resource is needed. In my scenario I leveraged Microsoft Sysinternals’ utility Sysmon. Sysmon (System Monitor) is a Windows Service that allows to capture and log process creation with full command line arguments, hashes, the loading of DLLs, network connections, and more. Installation is easily accomplished via: sysmon -accepteula -i -c custom-config.xml . Post-installation a much more feature rich logging environment has been set within the shellcompany.lan domain.
After installing Sysmon, you have the option to specify an XML configuration that defines what is captured. A great example to start off with is SwiftOnSecurity’s Sysmon configuration. This utility captures a significant amount of activity out of the box and allows you to hit the ground running with observing activity on your machine. I highly recommend looking at the XML to understand a bit more of how this configuration works as well as how you can add additional functionality.
Logging Infrastructure - Auditbeats & Auditd
Just like with Winlogbeat, Auditbeats focuses on logs being produced by Auditd. Auditd is a Linux Auditing daemon that can verbosely log on when a file is accessed, a network connection is created, a user logs in, etc… Combining Auditd’s verbose logging power with the ease of configuration of Auditbeats it’s easy to start getting logs in from your Linux environment into a SIEM. There are various open-source rulesets for Auditd. These rule sets include generic hardening considerations, specific compliance regulations, and even rulesets compliance with STIGs. Within my environment, I am leveraging a ruleset that can be found here.
Logging Infrastructure - Avoiding Too Much Logging
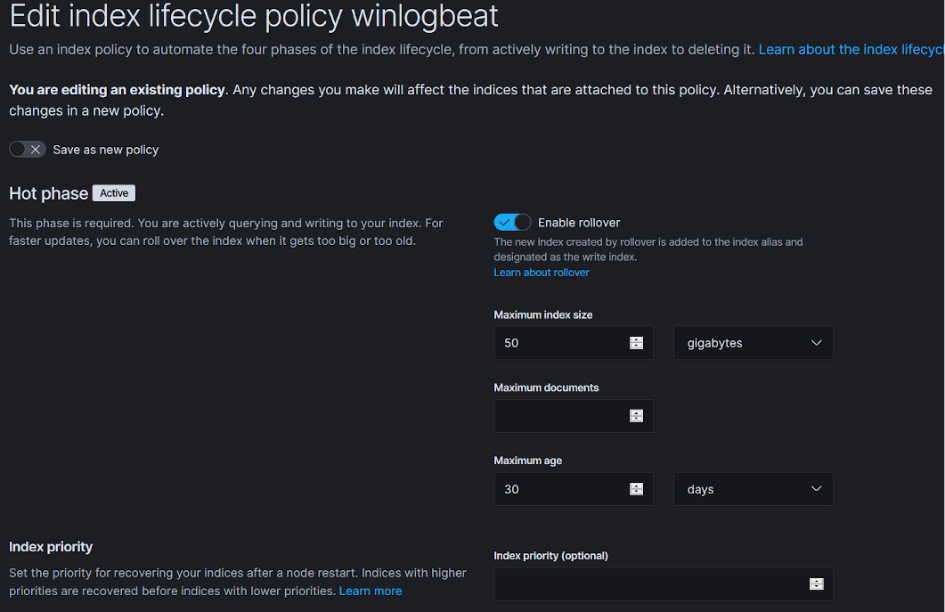
The logs produced by the Winlogbeats and Auditbeats can quickly result in generating a significant number of logs. To avoid over encumbering storage, consider applying an Elasticsearch index life cycle policy for when to purge, back-up, or rollover your data. If you feel that too much is being captured and shipped from clients, consider modifying the Sysmon/Auditbeats configurations. Or better yet, build dashboards that focus on the data you want. The index lifecycle policy below triggers after 30 days or if the index grows to 50 gigabytes.
Misconfiguring the Domain
To state the obvious, if I misconfigure a domain, I am fully aware of the actions I did. I wanted to be removed from modifications that have taken place within the domain so that I have something to discover while poking around within the environment. Searching around on Github will lead you to find several different PowerShell scripts to accomplish this goal. I personally used BadBlood by Secframe. BadBlood creates groups, users, OUs, changes permissions on files, etc.. This utility is easy to run and leaves you with a fantastically misconfigured environment.
Kali Up – Configuring Attack Machines
SANS recently released a C2 framework VM that has several C2 frameworks pre-configured. I did not want to introduce a new VM into my lab environment for the sole purpose of having pre-configured C2 frameworks. Instead, I wrote an Ansible playbook to go forth and fetch said resources. Kali Up, contains multiple roles to go and grab C2 frameworks and other tools that I find myself and others end up installing after a fresh install of Kali.
Analyzing the Data - Dashboards & Time
After initially getting the log forwarding established, you can start querying and aggregating data points about the network. However, if machines are not appropriately time sync’d correlating events across machines is going to be a nightmare. Do not forget to leverage your NTP server or default to UTC/GMT or some standard so your timeline lines up correctly when performing your post-execution analysis.
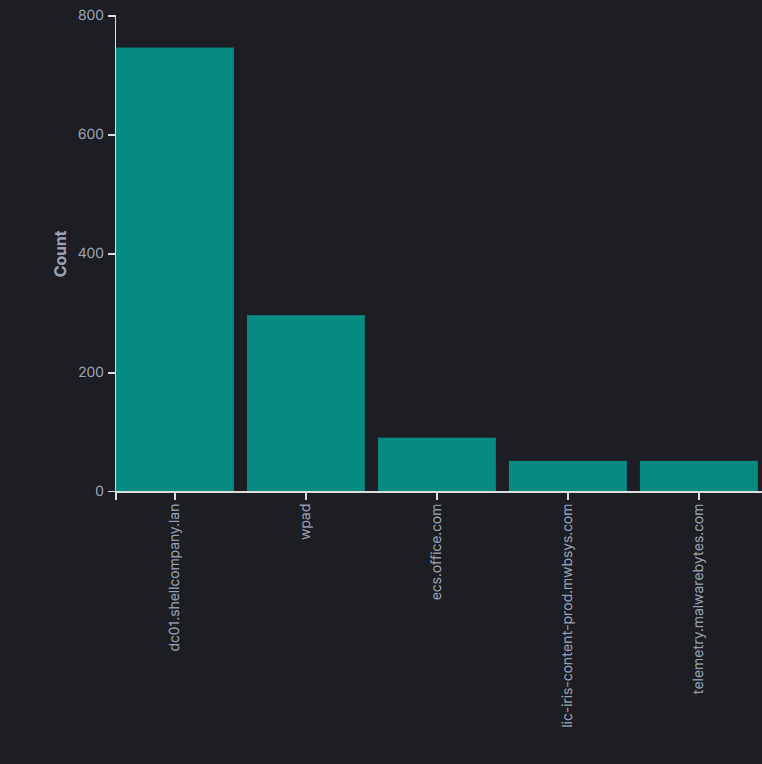
With data begin ingested from the range environment, it is easy to start creating dashboards and tracking events. For example, the image below shows DNS trends and top queries over the past X hours or weeks. In a relatively static environment, the addition of new applications that connect to the internet will make a large presence within the environment. While this will make it easy to filter out faux-C2 domains, it also will show other applications that have are rather chatty. While not pictured below, I have found that a great example of chatty applications are IDEs.
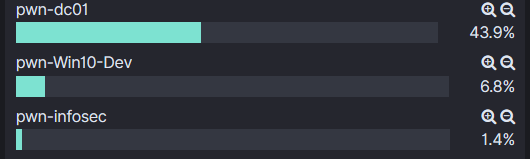
Each log forwarding agent allows for the configuration of a unique name. This ends up being a field within the Elasticsearch index that can also be pivoted on and allow for more direct queries.
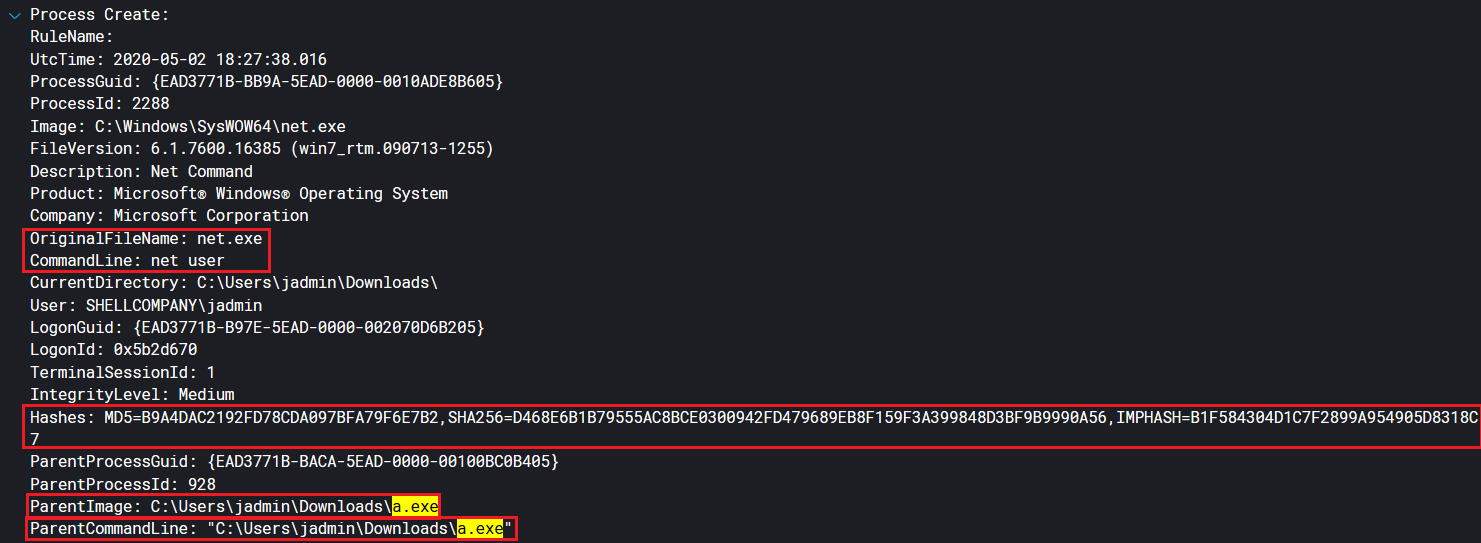
A quick logging test with a msfvenom generated payload, shows verbose information being captured by the SwiftOnSecurity Sysmon configuration. The images below display an initial network connection being made out to a hardcoded IP (10.20.20.32 - Kali machine). Expanding on documents surrounding this event, we start seeing post-exploitation recon events. The net user execution event shows the parent process (a.exe) that spawned net.exe as well as hashes around the executable.

Analyzing the Data - A Privilege Escalation Story
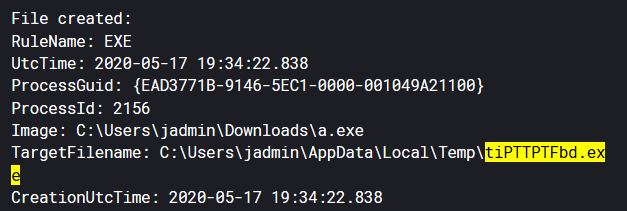
Following the trail of “a.exe” as a parent image, further execution is discovered. Next dear reader, sysprep.exe executes a file that a.exe dropped to disk.
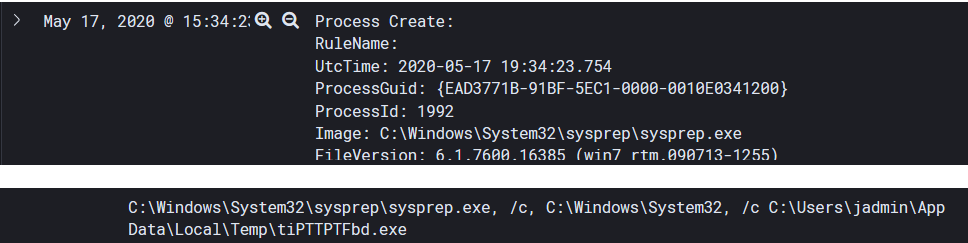 Sysprep.exe runs as a higher integrity process and has a history of being used in UAC bypasses.
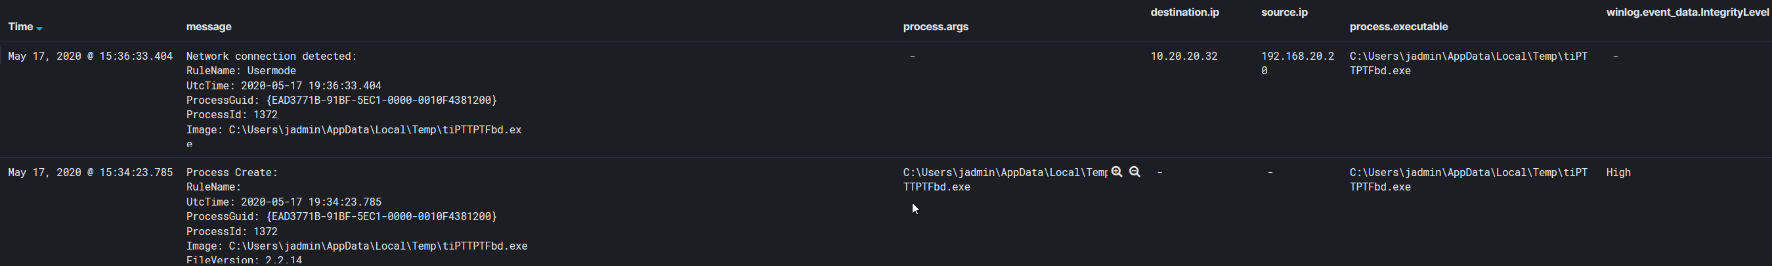
After sysprep.exe execution, the binary “tiPPTPTFbd.exe” is spawned as a high integrity process and connects back to 10.20.20.32. Hashes were produced during “tiPPTPFTFdb.exe” execution and further triage can occur for the defender. However, now the attacker likely has a higher integrity shell on the system… (spoiler we do).
The screenshots above capture perfectly why I wanted to setup this environment. Not only does this visibility make me a better red teamer it also makes me a better blue teamer. By understanding the actions on the system. All around, I can’t recommend having a home lab enough. Whether it’s one machine or a dozen, having a playground to build, break and revert has greatly helped me in this field. Also if you’re looking to learn more about UAC bypasses, an excellent workshop was given at DEF CON 25 on UAC bypasses and I highly recommend you check it out.
Expanding the Sysmon Configuration
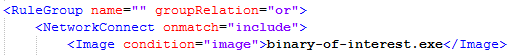
Consider the scenario where a prolific UAC bypass/privilege escalation vulnerability/etc… is being used and there’s no patch in sight. By modifying the Sysmon configuration file you can catch all activity with associated executables. The small snippet below demonstrates including “binary-of-interest.exe” within our Sysmon config when a network connection is made.
From a blue teamer perspective, understanding what odd looks like and being able to filter and pivot on data points is crucial to through tons of SIEM data. From a red teamer perspective knowing exactly what your tools are doing on the host allows insight into troubleshooting issues as well as knowing what artifacts being left behind.
Beyond the Blog
One large element I am missing within the environment is an additional domain for domain-trust attacks. This is something I plan to introduce later. This small domain also lends itself to be flexible of adding additional logging platforms by restoring to snapshots prior to Winlogbeats installs and adding a Splunk forwarder or a different logging environment.
Thank you for taking time to read this, please let me know if I’m missing something entirely or something I should look into to make the environment better.